머신러닝 맛보기
Train, Test, Scikit-Learn
머신러닝 중요 메서드
- fit() : 훈련시 사용하는 메서드, 두개의 데이터가 들어감.
- 독립변수 : fish_data(길이, 몸무게)
- 종속변수 : fish_target
- predict() : 예측할 때 사용
- 새로운 데이터 : 독립변수만 추가
- score() : 모형의 성능 평가
- 실무에서는 평가지표 함수를 사용!
- seed() : 초깃값이 같으면 동일한 난수를 뽑는다. 실험 재현성
- suffle : 주어진 배열을 랜덤하게 섞는다
생선 분류 예제
import matplotlib.pyplot as plt

# 데이터셋
# 도미 35
bream_length = [25.4, 26.3, 26.5, 29.0, 29.0, 29.7, 29.7, 30.0, 30.0, 30.7, 31.0, 31.0, 31.5, 32.0, 32.0, 32.0, 33.0, 33.0, 33.5, 33.5, 34.0, 34.0, 34.5, 35.0, 35.0, 35.0, 35.0, 36.0, 36.0, 37.0, 38.5, 38.5, 39.5, 41.0, 41.0]
# 빙어 14
bream_weight = [242.0, 290.0, 340.0, 363.0, 430.0, 450.0, 500.0, 390.0, 450.0, 500.0, 475.0, 500.0, 500.0, 340.0, 600.0, 600.0, 700.0, 700.0, 610.0, 650.0, 575.0, 685.0, 620.0, 680.0, 700.0, 725.0, 720.0, 714.0, 850.0, 1000.0, 920.0, 955.0, 925.0, 975.0, 950.0]

smelt_length = [9.8, 10.5, 10.6, 11.0, 11.2, 11.3, 11.8, 11.8, 12.0, 12.2, 12.4, 13.0, 14.3, 15.0]
smelt_weight = [6.7, 7.5, 7.0, 9.7, 9.8, 8.7, 10.0, 9.9, 9.8, 12.2, 13.4, 12.2, 19.7, 19.9]

length = bream_length + smelt_length
weight = bream_weight + smelt_weight

fish_data = [[l, w] for l, w in zip(length, weight)]
fish_target = [1] * 35 + [0] * 14 # 라벨링 : 도미1 / 빙어0

# 데이터 시각화
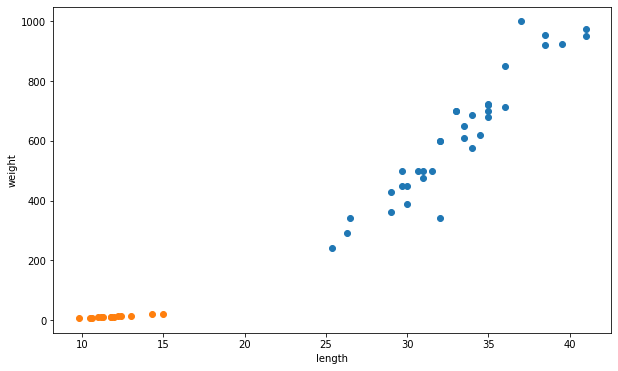
fig, ax = plt.subplots(figsize = (10,6))
ax.scatter(bream_length, bream_weight)
ax.scatter(smelt_length, smelt_weight)
ax.set_xlabel('length')
ax.set_ylabel('weight')

plt.show()

머신러닝 모형 구현 - KNN
- K-Nearest Neighbor
- 데이터를 가장 가까운 속성에 따라 분류하는 알고리즘
from sklearn.neighbors import KNeighborsClassifier # KNN lib

# 모형 구현
kn = KNeighborsClassifier()

# 모형 학습
kn.fit(fish_data, fish_target)

# 모형 평가
kn.score(fish_data, fish_target)

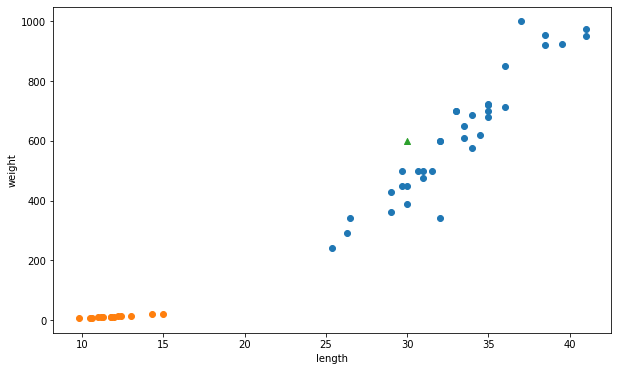
new_data = [[30,600]]
# 예측 (= 배포)
kn.predict(new_data)
# 결과 : 1
# 1의 의미 : 도미로 예측

# 예측한 new_data 시각화
ax.scatter(30,600,marker = '^')
plt.show()

훈련 세트와 테스트 세트
- 일반적으로 머신러닝 모형들은 훈련세트와 테스트 세트를 나눔
- 훈련 세트 : 훈련 시에 사용되는 데이터
- 테스트 세트 : 평가 시에 사용되는 데이터
#훈련 세트와 테스트 세트 분류
train_input = fish_data[:35]
train_target = fish_target[:35]
test_input = fish_data[35:]
test_target = fish_target[35:]

#학습 후 평가
kn = kn.fit(train_input, train_target)
kn.score(test_input, test_target)
# 결과 = 0
- 모형 만들고, 모형 테스트
- 결과가 0이 나온 이유?
- 학습을 도미로 함 / 테스트는 빙어로 함
- -> 학습을 섞어서 할 필요가 있다
랜덤으로 학습하기
import matplotlib.pyplot as plt
import numpy as np

input_arr = np.array(fish_data)
target_arr = np.array(fish_target)
np.random.seed(42) # 랜덤 시드 고정
index = np.arange(49)
np.random.shuffle(index)

train_input = input_arr[index[:35]]
train_target = target_arr[index[:35]]
test_input = input_arr[index[35:]]
test_target = target_arr[index[35:]]

# 섞인 train, test 시각화
fig, ax = plt.subplots(figsize = (10,6))
ax.scatter(train_input[:,0], train_input[:,1])
ax.scatter(test_input[:,0], test_input[:,1])

ax.set_xlabel('length')
ax.set_ylabel('weight')

plt.show()

KNN 머신러닝 모형 개발
kn = KNeighborsClassifier(n_neighbors = 5)

kn = kn.fit(train_input, train_target)
kn.score(test_input, test_target)

print(kn.predict(test_input))
# 결과 : [1. 1. 1. 1. 1. 1. 1. 1. 1. 1. 1. 1. 1.]
Scikit-Learn 라이브러리를 활용한 세트 분리
from sklearn.model_selection import train_test_split

#데이터 셋 만들기
fish_length = [25.4, 26.3, 26.5, 29.0, 29.0, 29.7, 29.7, 30.0, 30.0, 30.7, 31.0, 31.0,
                31.5, 32.0, 32.0, 32.0, 33.0, 33.0, 33.5, 33.5, 34.0, 34.0, 34.5, 35.0,
                35.0, 35.0, 35.0, 36.0, 36.0, 37.0, 38.5, 38.5, 39.5, 41.0, 41.0, 9.8,
                10.5, 10.6, 11.0, 11.2, 11.3, 11.8, 11.8, 12.0, 12.2, 12.4, 13.0, 14.3, 15.0]
fish_weight = [242.0, 290.0, 340.0, 363.0, 430.0, 450.0, 500.0, 390.0, 450.0, 500.0, 475.0, 500.0,
                500.0, 340.0, 600.0, 600.0, 700.0, 700.0, 610.0, 650.0, 575.0, 685.0, 620.0, 680.0,
                700.0, 725.0, 720.0, 714.0, 850.0, 1000.0, 920.0, 955.0, 925.0, 975.0, 950.0, 6.7,
                7.5, 7.0, 9.7, 9.8, 8.7, 10.0, 9.9, 9.8, 12.2, 13.4, 12.2, 19.7, 19.9]
#데이터 합치기
fish_data = np.column_stack((fish_length, fish_weight))

fish_target = np.concatenate((np.ones(35), np.zeros(14)))

# Scikit-Learn 라이브러리 활용
train_input, test_input, train_target, test_target = train_test_split(
    fish_data, fish_target, random_state=42
)
print(train_input.shape, train_target.shape)
print(test_input.shape, test_target.shape)
#(36, 2) (36,)
#(13, 2) (13,)

#모형 만들기
kn = KNeighborsClassifier(n_neighbors = 5)
kn = kn.fit(train_input, train_target)
kn.score(test_input, test_target)
# 결과 1.0 -> 섞어서 검사하니 알맞은 결과 도출.

Leave a comment